The record fell by a single dollar
On 26 June 2026, the Catalyst IQ Vehicle Price and Inventory Tracker registered an average new-vehicle transaction price of $51,820 in the United States. That figure edged past the previous all-time high of $51,819, set on 7 July 2023, by exactly one dollar — a rounding error that happens to mark a genuine turning point. Within four days the number had climbed again, to $51,974, leaving the market roughly $314 above where it sat in May and about $2,421 higher than in June 2025.
Put plainly: the average American buying a new car this summer is spending nearly $52,000 before they have paid a penny of interest, insurance or fuel.
Why the headline number is misleading — and why it still matters
Before we explain the causes, an honest caveat. Industry-wide averages fold in every six-figure luxury SUV and exotic sports car alongside the compact crossovers most people actually buy. Kelley Blue Book's transaction-price series has been running a few thousand dollars below the Catalyst figure through 2026, and analysis of the most popular twenty models in America has repeatedly shown them transacting nearer to $42,000, with compact SUVs, sedans and subcompacts often landing between $30,000 and $38,000.
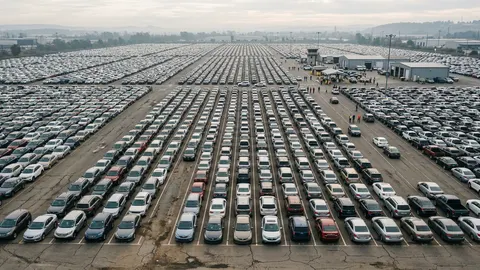
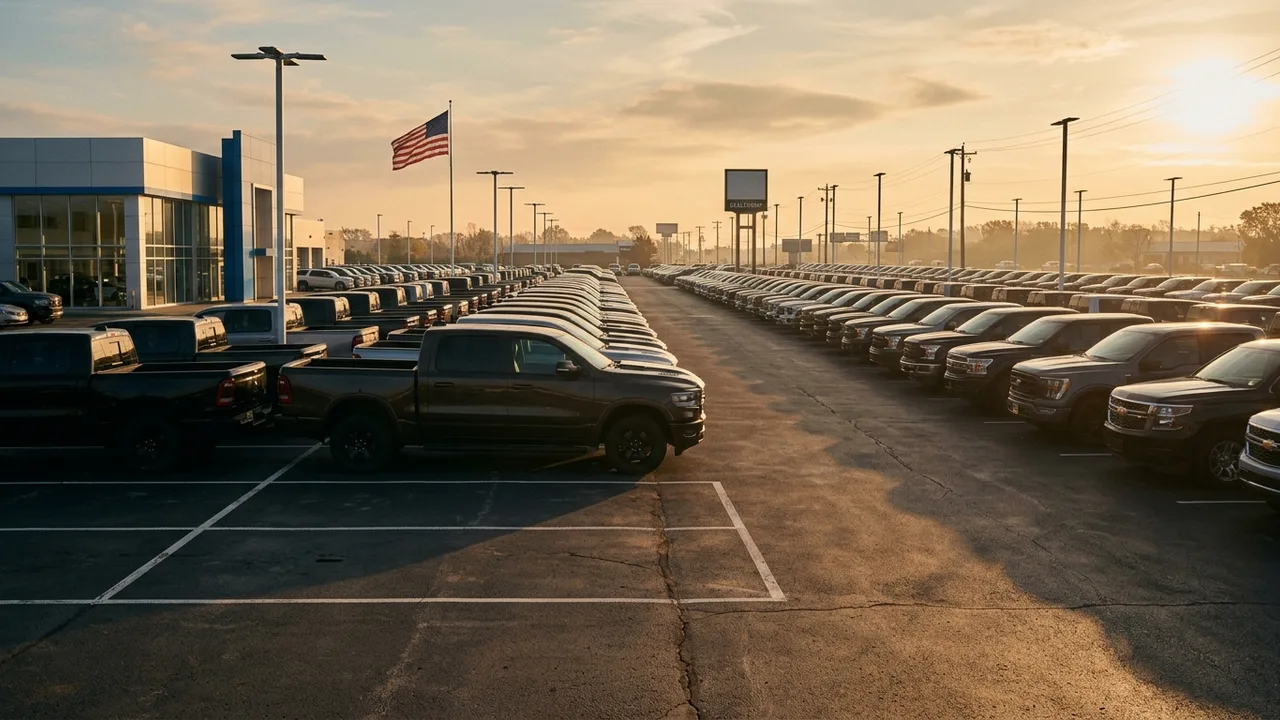
So the average buyer is not necessarily writing a $52,000 cheque. But the average is not a lie, either — it is a mix indicator. When it rises this fast, it is telling you that the composition of what America buys is shifting upward, and that the cheap end of the market is being hollowed out. CarGurus' mid-year review found the average new-vehicle listing price reached about $50,900 this spring, up 3.3% since December, and — more revealing — that dealer lots now hold more new vehicles priced above $50,000 than below $35,000.
That is the story. Not that cars got more expensive, but that affordable cars stopped being stocked.
Driver one: the mix keeps climbing
Segment data shows the increase is deeply uneven. Over the past year, mid-size luxury crossovers and SUVs saw average transaction prices rise by around $3,204, while mid-size sedans — the traditional value segment — moved just $262. Buyers are not paying more for the same car; they are buying a different, larger, more expensive car.
Demand for big metal has not blinked. Full-size SUVs have been turning on dealer lots roughly 16% faster than a year ago, with models such as the Cadillac Escalade and Toyota Sequoia clearing in under thirty days despite average transaction prices north of $80,000. When the fastest-moving inventory is also the most expensive inventory, the average has nowhere to go but up.
Driver two: incentives that only look generous
Manufacturers have leaned harder on discounts, but not by much. Average incentive spend has hovered around 6.9% of transaction price in 2026, up marginally month to month but essentially flat against a year earlier. In real terms, buyers are not getting more relief than they were in 2025 — they are simply getting the same percentage off a bigger number.
The exception is electric. Average new EV transaction prices have been running around $54,500, actually down a little year on year, but propped up by discounts averaging roughly 14–15% of transaction price. That is more than double the industry norm, and it tells you where demand genuinely stands post-incentive.
Driver three: financing has quietly become the main event
A $40,000 loan at 7% APR over sixty months costs about $792 a month and adds roughly $7,500 in interest across the term. At the new-car average, monthly payments above $900 — and increasingly above $1,000 — have stopped being unusual. Loan terms have stretched accordingly, with sixty-nine months now a common industry-average duration.
Wages have not kept pace. Median household income in the US has grown roughly 24% nominally since 2020, but only about 5% in real terms. Measured against income, a new car still costs something close to seven months of median household earnings — the same ratio as in 2020, even though the sticker looks far worse. The affordability squeeze is real, but it is a squeeze on cash flow, not just on price.
Where the pressure valve is
Buyers are voting with their feet, and they are walking toward older cars. Vehicles seven years old or more now account for roughly 40% of all used-vehicle sales in the United States — a striking figure, and a direct consequence of the sub-$35,000 new-car shelf emptying out. The near-new used segment is running hot too, with sales of 2024-and-later used vehicles up sharply year on year.
Some relief is structurally on the way. Off-lease volumes are forecast to rise around 25.7% in 2026, bringing close to half a million additional units back into the used market. That will not fix the new-car average, but it will widen the range of realistic options for people who simply cannot make $52,000 work.
What it means for buyers right now
Three practical conclusions follow from the data.
Shop the segment, not the headline. The industry average is a statistic about the market's mix, not about your purchase. Compact SUVs and sedans remain well below it.
Treat incentives as the negotiation, not the discount. With incentive spend flat and EV discounts running at double the industry rate, electric models are currently where manufacturer money is concentrated.
Model the payment, not the price. At current rates, the difference between a sixty-month and a seventy-two-month loan can quietly cost thousands. The 20/4/10 rule — 20% down, four-year term, 10% of gross income on total car costs — no longer clears at the average new-car price for a median earner, which is itself the clearest statement of where the market has landed.
Key takeaways
- Average new-vehicle transaction price hit a record ~$51,974 in late June 2026
- That is roughly $2,400 above June 2025 and one dollar past the July 2023 record
- Luxury mid-size crossovers rose ~$3,204 year on year; mid-size sedans just $262
- More new vehicles now sit above $50,000 on dealer lots than below $35,000
- Popular mainstream models still transact closer to $42,000
Sources & further reading
- Catalyst IQ Vehicle Price and Inventory Tracker (via Automotive News, reported by Motor1, July 2026)
- Cox Automotive / Kelley Blue Book transaction-price data 2026
- CarGurus 2026 Mid-Year Auto Market Review
- Edmunds Q1 2026 Used Car Report
- MoneyGeek analysis of KBB and BLS data
Figures, prices and policy details were current at the last-updated date above. Automotive pricing, incentives and regulations change frequently — verify time-sensitive details with the linked primary sources. Read our editorial policy and fact-checking standards.