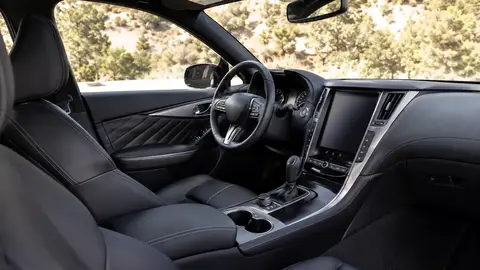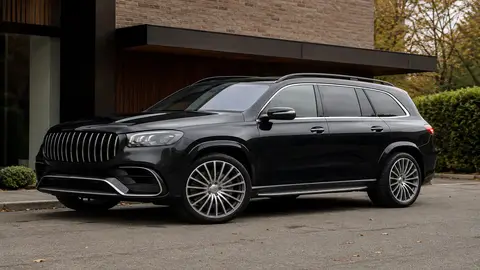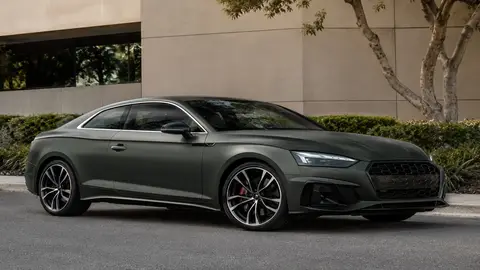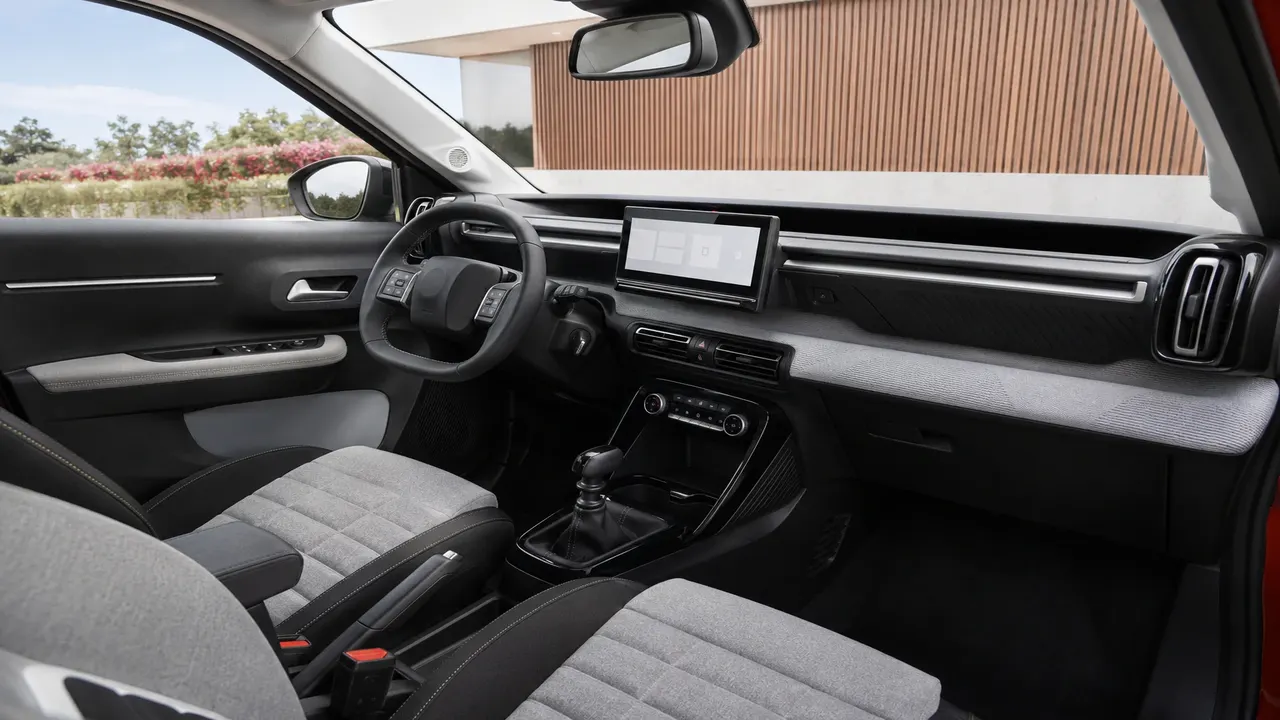
A premium comes from vehicle-specific factors (price, safety rating, repair cost, theft rate) combined with driver-specific factors (age, location, driving record) — and it is genuinely a range rather than a single number, because premiums for the same driver and the same car vary substantially between insurers. No calculator can reproduce this: the pricing models are proprietary and the inputs include data about you that no third party holds. The only figure worth budgeting against is a real quote. Sports cars, luxury vehicles and vehicles with high theft rates or expensive parts sit at the top of the range; family sedans, minivans and vehicles with strong safety ratings sit at the bottom.
True Motion Auto collects and presents information from official and primary sources (regulators, government bodies, lenders and insurers' published terms). This is general information, not personalised financial advice — check figures with the provider or a qualified adviser before acting. Jurisdiction: General — check your jurisdiction. Last checked: August 2026.
Editorial oversight: Vasudha Gupta, Editor.
At a glance: what affects car insurance premiums
| Factor | Effect on estimate |
|---|---|
| Vehicle price/repair cost | Higher price/parts cost pushes premium up |
| Safety rating | Strong ratings can lower the estimate |
| Vehicle theft rate | High-theft models push premium up |
| Driver age/experience | Younger, newer drivers see higher estimates |
| Location | Urban/high-claim areas typically higher than rural |
| Driving record | Prior claims/violations raise the estimate significantly |
What a premium is built from
Two categories of input. Vehicle-side factors: purchase price, typical repair and parts cost, safety ratings, and theft statistics for that model. Driver-side factors: age, years licensed, location, and claims and conviction history. Insurers weight these differently and add data of their own, which is why the same risk produces materially different prices across the market.
Because of that, treat everything on this page as directional — it tells you which way a factor pushes and roughly how hard, so that when you have real quotes in front of you, you can tell which parts you are able to change. Get at least three quotes on the exact vehicle before you commit to buying it, and get them both directly and through a comparison service, since the two cover different panels of insurers.
Why real quotes vary so much between insurers
- Different risk models. Each insurer weighs the same factors differently based on their own claims history.
- Regional licensing/regulation differences. Insurance is regulated at the state/provincial or national level in most markets, and rules on rate-setting factors differ.
- Bundling and loyalty discounts. Multi-policy discounts, safe-driver programs and telematics-based discounts can shift a real quote well outside a generic estimate.
- Credit-based scoring (where legally permitted) — some insurers factor in credit history, others are barred from doing so by state law.
Vehicle factors that move the estimate most
| Vehicle factor | Typical effect |
|---|---|
| High-performance/sports car | Higher premium — higher claim severity and speed-related risk |
| High theft-rate model | Higher premium — reflects comprehensive claim frequency |
| Strong IIHS/NHTSA safety rating | Can lower premium — reduced injury claim severity |
| Expensive-to-repair parts (many EVs, luxury brands) | Higher premium — costlier collision/comprehensive claims |
| Minivan/family sedan with strong safety record | Typically lower premium among mainstream vehicles |
- Purchase price and replacement cost — pricier vehicles generally cost more to repair or replace, which flows straight into the premium
- Safety ratings and crash-avoidance tech — models with strong NCAP/IIHS-style ratings and standard automatic emergency braking often qualify for real discounts
- Repair and parts cost — vehicles with expensive or hard-to-source body panels, sensors, or batteries (common on EVs and luxury models) rate higher even at a similar purchase price
- Theft rate for that specific make and model — some vehicles are disproportionately targeted, which raises comprehensive coverage cost regardless of the driver
- Engine size and power — higher-performance trims typically carry a rating surcharge versus the standard trim of the same model
- Vehicle age — newer cars cost more to insure for collision/comprehensive coverage in raw dollar terms, but older cars can cost more proportionally if parts are scarce
Driver factors that move the estimate most
Age and experience remain some of the strongest predictors in most markets — drivers under 25 and those with fewer than 3 years of licensed driving typically see meaningfully higher estimates. Location matters too: dense urban areas with higher accident and theft frequency generally price higher than rural areas, and this is one of the largest single swings in the estimate.
How to use any general figure sensibly
- Use general figures to compare vehicle choices against each other, never as a number to budget against.
- Get three or more real quotes before making a purchase decision that turns on insurance cost.
- Ask every insurer about bundling, telematics and usage-based programmes, and safe-driver discounts. None of these appear in any general figure, and together they can move a real quote substantially.
- Re-quote if your address, the primary driver, or the vehicle changes — each of those can move the price more than the others combined.
Never treat an online insurance estimate as a locked-in price. Get a real, written quote before signing a purchase or lease agreement if insurance cost is a deciding factor.
Common mistakes people make with insurance estimates
The biggest mistake is comparing a general estimate for one vehicle against a real quote for another. Compare quote against quote, on the same cover, the same excess and the same named drivers, or the comparison means nothing. The second is ignoring that adding a young or high-risk secondary driver to a policy can shift the real premium far more than the vehicle choice itself.
Frequently asked questions
Why did my real quote come in higher than a published estimate?
Do electric vehicles cost more to insure?
Does a car's color affect insurance cost?
How much does age affect car insurance premiums?
Can I lower my premium without changing cars?
Sources & further reading
- III (Insurance Information Institute) — Auto Insurance Basics
- NAIC — Understanding Auto Insurance
- IIHS-HLDI — Insurance Losses by Vehicle Model
- UK Financial Conduct Authority — insurance guidance for consumers
- MoneyHelper (UK) — how to shop for car insurance
Figures, prices and policy details were current at the last-updated date above. Automotive pricing, incentives and regulations change frequently — verify time-sensitive details with the linked primary sources. Read our editorial policy and fact-checking standards.