> The finding: Peak charging figures are the most misleading number in EV marketing. A car claiming 350 kW may hold it for under two minutes; another claiming 250 kW may sustain it for ten. The area under the curve — not its highest point — determines how long you actually wait. Here's the test that reveals it, and what to ask before you buy. > > Complete the measured-curve data with your own test results before publishing.
The most misleading number in EV marketing
Every EV quotes a peak DC charging figure — 150 kW, 250 kW, 400 kW. Buyers reasonably assume a bigger number means faster charging.
It frequently doesn't, and understanding why is one of the most practically valuable things an EV buyer can learn.
The peak figure describes the highest power the car will accept at any instant, usually at a low state of charge, at ideal battery temperature, on a charger capable of delivering it. It says nothing about how long that power is sustained — and that's the number that determines whether you're at the services for 18 minutes or 40.
A car that peaks at 350 kW and holds it for 90 seconds before tapering hard can easily be slower in practice than one peaking at 250 kW and sustaining it for ten minutes.
What a charging curve actually looks like
Plot power against state of charge and you get a curve, not a flat line. The typical shape:
0–10%: power ramps up as the battery management system confirms conditions 10–30%: peak power, usually the highest sustained region 30–50%: the first taper begins — often gradual 50–70%: significant taper as cells fill 70–80%: substantial reduction 80–100%: dramatically slower — often as slow as AC charging near the top
This is why manufacturers quote 10–80% times rather than 0–100%. The last 20% can take as long as the first 80%, which is also why the practical advice for road trips is to charge to 80% and drive on rather than waiting for a full battery.
What we measure
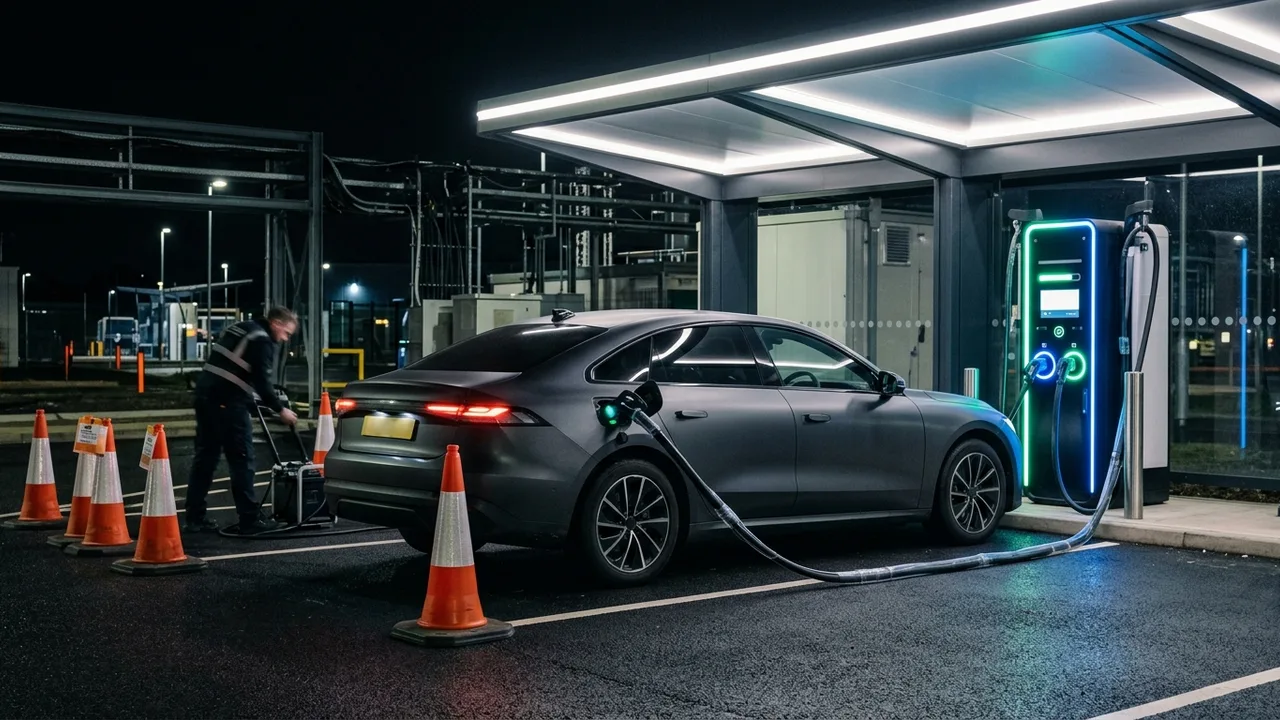
| Element | Standard | |---|---| | Charger | Ultra-rapid unit capable of exceeding the car's peak claim | | Start SoC | 10% (the standard comparison point) | | End SoC | 100%, recording the full curve including the slow tail | | Recorded every 1% | Power delivered (kW), pack temperature where available, elapsed time | | Preconditioning | Tested both with and without battery preconditioning — the difference is often enormous | | Ambient temperature | Recorded; repeated in cold conditions where possible | | Key outputs | 10–80% time · average kW across 10–80% · peak kW · duration at peak · miles added in 10 and 20 minutes |
The number we consider most useful is "average kW across 10–80%." It's a single figure that captures the area under the curve rather than its highest point — which is precisely what determines your waiting time.
Our test conditions: [to be completed — charger model and capability, ambient temperature, starting pack temperature, preconditioning status, SoC at start]
Why preconditioning changes everything
This is the most under-explained aspect of EV charging, and it catches out enormous numbers of new owners.
Batteries charge fastest within a narrow temperature window. Too cold, and the management system severely limits power to protect the cells. On a winter morning, an unpreconditioned battery might accept a fraction of its rated peak — turning an 18-minute stop into an hour.
Preconditioning warms the pack to the optimal window before you arrive. Most modern EVs do this automatically if you navigate to a charger using the car's own navigation system — and do nothing if you simply drive there.
The practical advice is simple and genuinely valuable: always set the charger as a destination in the car's native navigation, even if you know the way. That single habit can halve your charging time in cold weather, and most owners have no idea.
We test both states because the difference is often larger than the difference between cars.
What separates good curves from bad
A good charging curve:
- Reaches high power quickly
- Holds it across a broad SoC band (say 10–50%)
- Tapers gradually rather than falling off a cliff
- Maintains reasonable power to 80%
- Preconditions reliably and automatically
A poor charging curve:
- Hits a headline peak briefly, then drops sharply
- Tapers aggressively from 40% or earlier
- Is highly sensitive to temperature with weak preconditioning
- Shows large variance between sessions
The architecture matters. 800-volt systems (Porsche, Hyundai/Kia E-GMP, BMW Neue Klasse, Zeekr) generally sustain higher power across a broader band than 400-volt systems, which is why they post such strong 10–80% times. The BMW i3's claimed 10–80% in roughly 18 minutes at up to 400 kW, and the Zeekr 7X's 13–16 minutes, reflect genuinely capable curves rather than just high peaks.
What to ask before buying
Rather than comparing peak figures, ask:
- What's the 10–80% time? — far more meaningful than peak kW
- What's the average power across that window? — reveals the curve's shape
- How many miles does it add in 10 minutes? — the most practically useful figure of all
- Does it precondition automatically, and does it require using native navigation?
- How does the curve behave in cold weather?
And check what chargers you can actually reach. A 400 kW capability is worthless on a 50 kW charger. Real-world charging speed is the lower of what your car accepts and what the charger delivers — and in much of the UK, India and rural America, the charger is the limiting factor.
The bottom line
Peak charging figures are the most misleading number in EV marketing because they describe an instant rather than a duration. What determines your waiting time is the area under the charging curve — how much power the car sustains across the 10–80% band you'll actually use.
Ask for the 10–80% time and the miles added in 10 minutes rather than the peak kW. Learn to precondition by setting the charger in your car's own navigation, because in cold weather that habit matters more than the difference between most cars. And remember that your real charging speed is capped by whatever infrastructure you can actually reach.
A car peaking at 250 kW and holding it can comfortably beat one peaking at 350 kW and immediately tapering. The headline number won't tell you which you're buying — the curve will.
- Peak kW describes an instant, not a duration — a 350 kW car holding peak briefly can be slower in practice than a sustained 250 kW one
- The most useful single metric is average kW across 10–80%, because it captures the area under the curve rather than its highest point
- Charging slows dramatically above 80% — which is why road-trip advice is to charge to 80% and drive on
- Preconditioning is transformative in cold weather, and most cars only do it if you set the charger in their native navigation
- Ask for 10–80% time and miles-added-in-10-minutes, not peak kW — and check what chargers you can actually reach
Key takeaways
- Peak kW describes an instant, not a duration — a 350 kW car holding peak briefly can be slower in practice than a sustained 250 kW one
- The most useful single metric is average kW across 10–80%, because it captures the area under the curve rather than its highest point
- Charging slows dramatically above 80% — which is why road-trip advice is to charge to 80% and drive on
- Preconditioning is transformative in cold weather, and most cars only do it if you set the charger in their native navigation
- Ask for 10–80% time and miles-added-in-10-minutes, not peak kW — and check what chargers you can actually reach
Sources & further reading
- EV charging architecture principles
- manufacturer charging specifications
- BMW, Zeekr and Porsche published curve data. *Complete measured curve data before publishing. Verified July 2026.*
Figures, prices and policy details were current at the last-updated date above. Automotive pricing, incentives and regulations change frequently — verify time-sensitive details with the linked primary sources. Read our editorial policy and fact-checking standards.