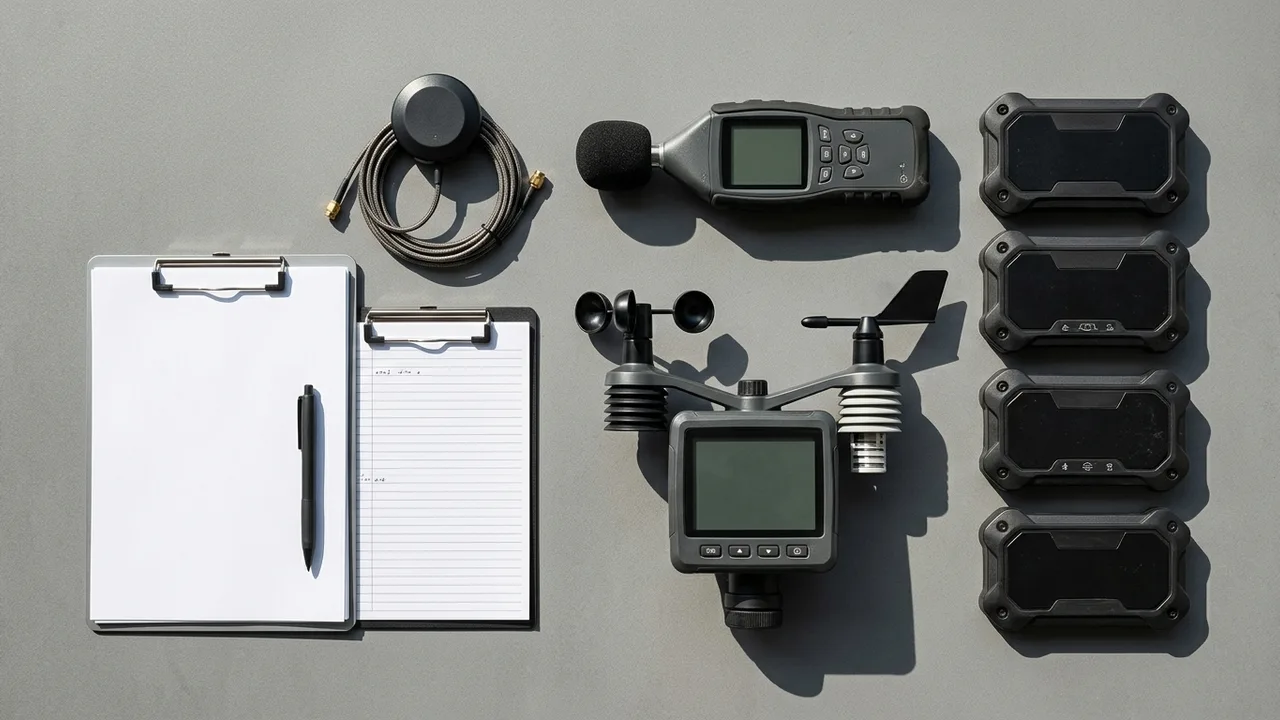
Why we publish this
Every number in our performance-data section rests on a method — someone else's method. True Motion Auto does not measure cars. We do not run a press fleet, borrow manufacturer demonstrators or take instrumented readings of our own, so every acceleration time, braking distance, decibel reading, range result and charging curve on this site was produced by a manufacturer or by an independent outlet, and is attributed to whoever produced it.
What this section does is gather those published figures, set them beside each other properly, and explain what they mean. That is only useful if you know how the underlying tests work — which figures are robust, which are easily flattered, and which cannot fairly be compared with each other at all. This page is that reference.
It exists for three reasons. Transparency: you should be able to see where a number came from and interrogate it at source. Comparability: two figures produced under different protocols are not the same measurement, and we say so rather than lining them up in a table as though they were. Accountability: setting out the standard we hold quoted figures to means we can be held to it.
The core principle: conditions are part of the result
A performance figure without its conditions is close to meaningless. A 0–60 time recorded at sea level on a warm day with a prepared surface is a materially different measurement from one recorded at altitude, in the cold, on cold tyres.
So when we quote an instrumented result, we look for the conditions the tester recorded alongside it:
- Date and time
- Location and elevation
- Ambient temperature and, where relevant, surface temperature
- Barometric pressure and humidity
- Wind speed and direction
- Surface type and condition
- Tyre specification, age and pressures
- Fuel level or state of charge
- Occupants and payload
Few published tests record all of that, and we do not pretend otherwise. Where the conditions behind a figure are not stated, we say the figure is unqualified rather than presenting it as directly comparable with one that is.
Acceleration figures, and what they are worth
Most quoted acceleration numbers follow one of a handful of conventions. Knowing which convention produced a figure tells you how much weight it will bear:
| Measurement | What it is, and how testers usually produce it |
|---|---|
| 0–60 mph / 0–100 km/h | The headline sprint. Normally GPS-timed, often the best of several runs, and ideally run in both directions to cancel gradient and wind — reputable outlets state which |
| 0–100 mph, 0–130 mph | Higher-speed increments, published only where the car and the venue allow; a better guide to sustained power than the 0–60 |
| 5–60 mph rolling | From a rolling start, without launch control — closer to how the car behaves on a road than a standing start on a prepared surface |
| 50–75 mph / 40–80 km/h | The overtaking increment, and arguably the most useful figure published, because it is the one drivers actually use |
| Quarter mile | Elapsed time and trap speed, from drag-strip practice |
| Repeated runs | Consecutive runs recorded individually, which is what exposes heat soak; many published tests report only the best run |
Two points deserve emphasis when reading these numbers.
Trap speed says more about power than elapsed time does. Quarter-mile ET can be flattered by traction and launch software; trap speed reflects how hard the car is still pulling after 400 metres. Where a power claim looks generous, trap speed is the figure we weigh most heavily.
A single best run is not the whole story. One heroic launch measures peak capability in ideal conditions; consecutive runs reveal thermal management and whether the car can sustain what it claims. This matters most for EVs, whose output can derate significantly with heat and state of charge. Where a published test reports repeated runs, we quote the later ones as well as the best — and where it does not, we say the figure is a peak.
Braking figures
| Measurement | What it is, and how testers usually produce it |
|---|---|
| 70–0 mph | The standard US-market stop: maximum effort, ABS engaged, on a stated surface |
| 100–0 mph / 100–0 km/h | Higher-speed stops, published where the venue allows; 100–0 km/h is the usual European equivalent |
| Consecutive stops | A repeated sequence with standardised cooling intervals, which is how fade is exposed |
| Useful outputs | Best stop · average across the sequence · degradation from first stop to last |
A repeated-stop sequence is the figure worth hunting for. The first stop measures the best case; the last measures what happens when you genuinely need it twice in a minute. Fade is where good cars and adequate cars separate, and it never appears in a single number — so where an outlet publishes a full sequence, we quote the degradation as well as the headline distance.
Roadholding figures
- Skidpad: maximum sustained lateral acceleration in g, conventionally measured on a 300-ft circle in US testing, in both directions and averaged. European outlets more often publish slalom or lane-change speeds, which are not interchangeable with a skidpad figure
- Read it with the tyre: the tyre specification frequently explains most of the difference between two cars' numbers, so we quote it whenever the source records it
EV measurements: where published tests diverge most
Electric cars are where test protocols vary most widely, and where two honestly produced figures can differ by a third simply because of how they were obtained:
| Measurement | What it is, and why published figures differ |
|---|---|
| Official range | WLTP, EPA or ARAI — homologated laboratory figures, not real-world results. We always name the standard, because the three are not comparable |
| Real-world range | Usually a fixed mixed route, or a constant-speed highway run at 70–75 mph. A route run in one direction only is exposed to prevailing wind; better tests run both ways |
| Climate control | The single biggest source of divergence. Some published range tests reduce or switch off heating and cooling; a figure obtained that way is not one an owner can replicate, and we flag it |
| Charging curve | Power logged across the state-of-charge band, with or without battery preconditioning — a preconditioned curve can look dramatically better, so the distinction matters |
| Key charging outputs | 10–80% time · average kW across 10–80% · miles added in 10 and 20 minutes, which is the number that actually governs a journey |
| Season | Cold-weather results can fall well below summer ones on the same car; a range figure without a season attached tells you little |
This is why we rarely publish a single EV range number. Where independent figures exist from more than one source, we report the spread and the conditions each was obtained in, rather than picking the most flattering result and presenting it as settled.
Everyday measurements
Cabin noise: quoted in dBA at a stated speed — commonly idle, 50 mph and 70 mph — and only meaningful with the surface stated, since coarse and smooth surfaces differ by several dBA. Readings from different outlets on different roads should not be compared directly, and we do not stack them in a single table as though they were.
Boot space: manufacturers quote litres, but to different standards — to the parcel shelf or to the roof, VDA method or not — which is why two similar boots can carry very different-looking claims. Where an outlet publishes a standardised suitcase count (carry-on cases at roughly 55 × 40 × 20 cm, large cases at 75 × 50 × 30 cm), that is the more useful figure, and we quote aperture dimensions, load-lip height and flat-fold behaviour from the manufacturer's own data.
Fuel economy: official WLTP or EPA figures are homologated, not observed. Independent brim-to-brim results over a fixed route are the closest thing to a real-world number, and we attribute them. PHEVs need three figures to be understood — starting charged, starting depleted, and a realistic weekly average — and the depleted figure is the one most owners should plan around, so it is the one we look for.
Weight: manufacturer kerb weights are quoted to different conventions across markets (with or without a driver, with or without a full tank). Where an outlet has weighed a car itself, we use that figure and credit it, and we note when a measured weight departs materially from the claim.
What we don't do
We don't present other people's measurements as ours. Every instrumented figure in our results tables carries the name of the manufacturer or outlet that produced it. Nothing on this site is a number we recorded.
We don't mix protocols in a single comparison. A WLTP range does not belong in the same column as an EPA one, a manufacturer's claimed 0–60 does not belong beside an independently timed one, and a skidpad figure is not a slalom speed.
We don't cherry-pick the flattering source. Where credible published results disagree, we report the range and let the disagreement stand rather than quoting whichever number suits the verdict.
We don't repeat a figure whose conditions are unknown without saying so. An unqualified number is published as an unqualified number.
We don't estimate. Where no one has measured something, we say it has not been measured rather than modelling a plausible figure and presenting it as a result.
When we get it wrong
Sourcing figures involves judgement, and errors are possible — a misread table, a figure attributed to the wrong variant, a result superseded by a later test. If we publish a figure we later determine to be wrong, we correct it visibly — with a dated note explaining what changed and why — rather than quietly amending the page.
Equally, published figures can change legitimately. Software updates can materially alter a car's behaviour, and where an outlet re-tests a car after one, we update our comparison to match and note the revision.
The bottom line
Numbers only mean something if you know how they were produced and by whom. This page exists so that every instrumented figure we quote can be traced to its source, read in the light of the protocol behind it, and — where necessary — challenged.
The short version: we do not measure cars, we source measurements. We name who produced each one, we quote the conditions where they were recorded, we refuse to compare figures obtained under different protocols, and we report disagreement between credible sources instead of hiding it.
If you spot a figure on this site you think is wrongly sourced or wrongly compared, tell us. That is rather the point of publishing this page.
Key takeaways
- True Motion Auto does not take instrumented measurements: every figure is a manufacturer or independent result, attributed to whoever produced it
- Conditions are part of the result — a figure published without them is quoted as unqualified, not treated as comparable
- Trap speed is a better guide to power than quarter-mile ET, and repeated runs and repeated stops say more than a single best result
- EV range figures diverge most because of climate control, direction of travel, preconditioning and season, so we report the spread rather than one number
- Figures obtained under different protocols — WLTP against EPA, claimed against measured, skidpad against slalom — are never lined up in the same column
Sources & further reading
- True Motion Auto testing standards
- industry instrumented-testing best practice. Verified July 2026.
Figures, prices and policy details were current at the last-updated date above. Automotive pricing, incentives and regulations change frequently — verify time-sensitive details against the primary sources listed below. Read our editorial policy and fact-checking standards.