Car insurance premiums are calculated by combining risk factors about you (driving record, age, credit score in most states, annual mileage) with risk factors about your vehicle (make, model, safety ratings, repair cost, theft rate) and your location (state, ZIP code, claim rates in your area). The national US average for full coverage is approximately $2,513/year ($209/month) in 2026, but this masks enormous variation — a 20-year-old in urban Maryland may pay over $4,000/year while a 40-year-old with a clean record in rural Iowa pays under $1,200. Every factor is rated against statistical claims data from millions of policies.
Key premium factors and their typical impact
| Factor | High-risk profile | Low-risk profile | Typical premium impact |
|---|---|---|---|
| Driving record (last 3 yrs) | DUI + 2 at-fault accidents | Clean record | +50–200% vs clean |
| Age | Age 20 (male) | Age 45 | ~2× higher at 20 |
| Credit score (most states) | Poor (below 580) | Excellent (750+) | +20–50% for poor credit |
| Vehicle type | Sports car / luxury SUV | Mid-size sedan / SUV | +15–40% |
| Location | High-density urban (NY, MD) | Low-density rural | +50–200% |
| Annual mileage | 20,000+ miles/year | Under 7,500 miles/year | +10–25% |
| Coverage level | Full coverage + low deductible | State minimum liability | 2–4× difference |
The actuarial foundation: risk pooling
Insurance companies use actuarial data — statistical analysis of claims across millions of policyholders — to assign each driver a risk profile. Premium = expected claims cost for your risk group + insurer's operating costs + profit margin. Every variable in your policy is a proxy for how likely you are to file a claim and how large that claim is likely to be.
The national average for full-coverage auto insurance reached approximately $2,513/year in 2026, up from prior years driven by higher vehicle repair costs, labour shortages in body shops, expensive EV battery replacements, and increased severe weather events. Rates vary by state from roughly $1,100/year in states like Maine and Iowa to over $4,000/year in Maryland, Connecticut and New York.
Personal factors: what insurers assess about you
Driving history
This is the most heavily weighted individual factor. At-fault accidents and moving violations (speeding tickets, DUIs, reckless driving) signal elevated claims risk. Most insurers look back 3–5 years; serious violations like DUIs can affect rates for 5–7 years or result in coverage being offered only through non-standard markets at high rates.
Age and gender
Statistical claims data consistently shows young drivers — especially males under 25 — have significantly higher accident rates. Average full-coverage premiums for a 20-year-old male in the US can exceed $3,500/year; by age 30, they fall to approximately $1,700. Gender-based pricing is prohibited in some states (California, Michigan, Massachusetts, Hawaii, Montana, North Carolina, Pennsylvania).
Credit score (where permitted)
Most states allow insurers to use credit-based insurance scores — a scoring model derived from credit data that correlates with claims frequency and severity. California, Hawaii and Michigan prohibit its use entirely. Where it is permitted, poor credit can add 20–50% to premiums. Improving your credit score is one of the most effective ways to reduce insurance costs if you live in a state where it is used.
Annual mileage and usage
The more you drive, the more exposure you have. Insurers increasingly offer telematics or pay-per-mile programmes (e.g., Progressive Snapshot, Allstate Milewise) where low-mileage drivers can reduce premiums by 10–30% by opting into usage tracking.
Vehicle factors: what the car itself signals about risk
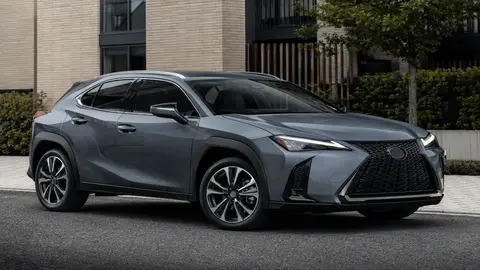
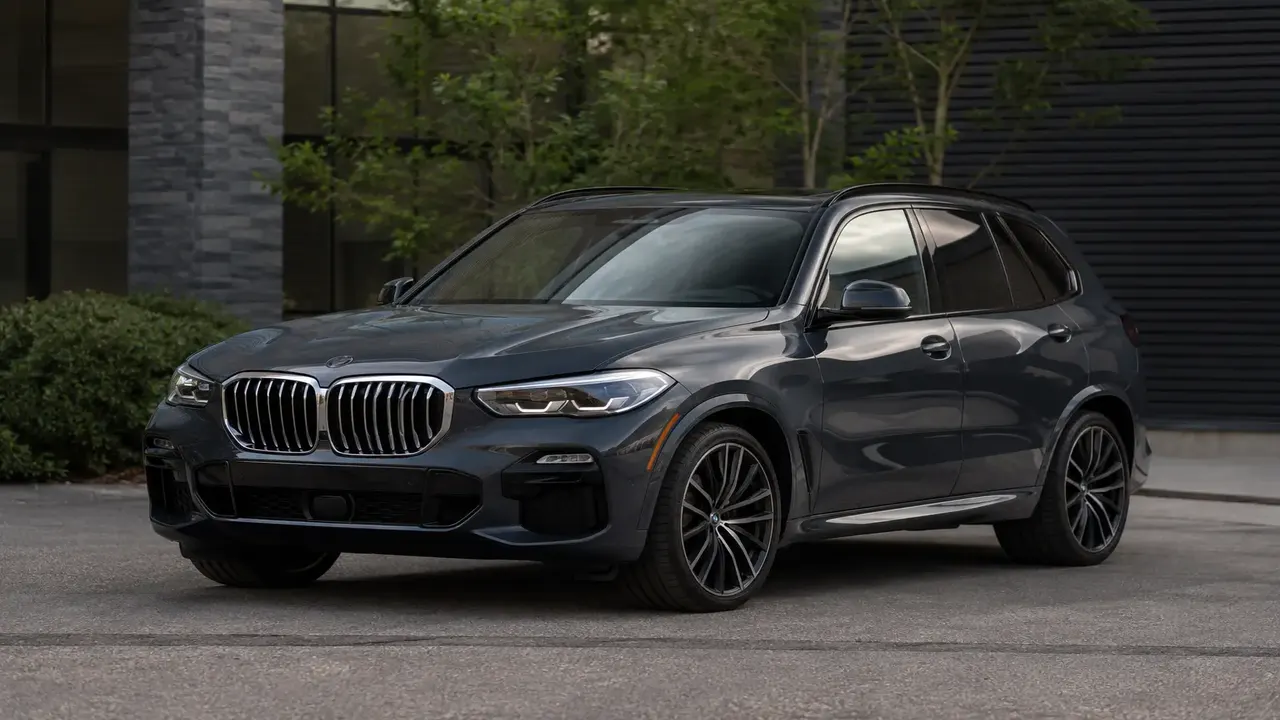
- Vehicle value and repair cost: a $65,000 SUV with complex sensors and expensive replacement parts costs more to insure against collision and comprehensive claims than a $22,000 sedan.
- Safety ratings: IIHS and NHTSA crash test ratings influence liability and medical payment claim rates. Five-star rated vehicles often attract slight discounts.
- Theft rates: some vehicle models are targeted disproportionately. The NICB (National Insurance Crime Bureau) publishes annual theft statistics by model.
- Body style: sports cars carry higher premiums than family sedans across most risk tiers.
- EV-specific factors: EVs have lower maintenance claims but higher collision repair costs (battery involvement in accidents). Average EV insurance is approximately 10–25% higher than comparable ICE vehicles in 2026.
Location factors: geography matters enormously
Your ZIP code affects every component of your premium:
- Urban vs rural: higher traffic density, more theft, and more litigation drive urban rates up sharply.
- State regulations: states like Michigan (high PIP requirements), New York and Maryland have structurally higher rates due to coverage mandates, litigation environments and high medical costs.
- Weather risk: coastal and tornado-prone areas carry higher comprehensive premiums for weather damage.
- Uninsured motorist rates in your state: states with high uninsured driver rates translate to higher UM/UIM coverage costs.
Coverage choices: the levers you control
The biggest single variable you control is coverage type and deductible:
- Liability only (minimum coverage): covers damage you cause to others; cheapest option but leaves your own vehicle unprotected.
- Full coverage (liability + collision + comprehensive): required by lenders if you are financing or leasing. Collision covers accidents; comprehensive covers theft, weather and non-collision damage.
- Deductible level: raising your collision deductible from $500 to $1,000 typically reduces the premium by 10–15%. Raising to $2,000 can save 20–25%.
- Optional extras: gap insurance, rental reimbursement, roadside assistance — each adds to the premium. Gap is important for financed vehicles; evaluate others against realistic likelihood of use.
Auto insurance rates for identical coverage can vary by 50–100% between carriers for the same driver and vehicle. Get quotes from at least 3–5 insurers every year or whenever your situation changes (new vehicle, moved, improved credit). Loyalty to a single insurer rarely produces the lowest rate.
UK and India notes
In the UK, premiums are calculated on similar factors but credit score is not used; claims history (no-claims discount, or NCD) is particularly influential — drivers can build up to 5 years of NCD for significant discounts. UK average premiums in 2026 are approximately £600–£900/year for a mid-range driver, though young driver premiums can exceed £2,000. In India, third-party liability insurance is mandatory; comprehensive cover is additional, and premiums are regulated by IRDAI but vary by vehicle type, age and zone.
Frequently asked questions
Why did my insurance premium go up even though I have had no accidents?
Does my credit score affect car insurance?
How does a lender requirement for full coverage affect my premium?
What is the cheapest way to insure a car I drive rarely?
Does filing a small claim raise my premium more than the claim is worth?
Sources & further reading
- Insurify — Average Cost of Car Insurance in the US 2026
- The Zebra — State of Insurance Auto Report 2026
- National Association of Insurance Commissioners — Auto Insurance Overview
Figures, prices and policy details were current at the last-updated date above. Automotive pricing, incentives and regulations change frequently — verify time-sensitive details with the linked primary sources. Read our editorial policy and fact-checking standards.