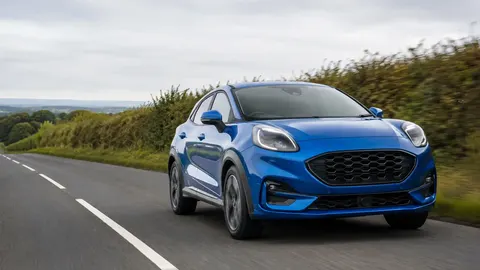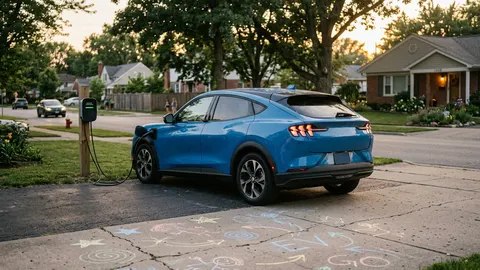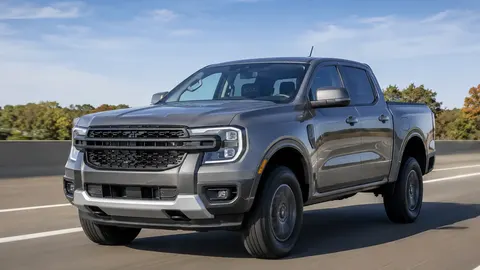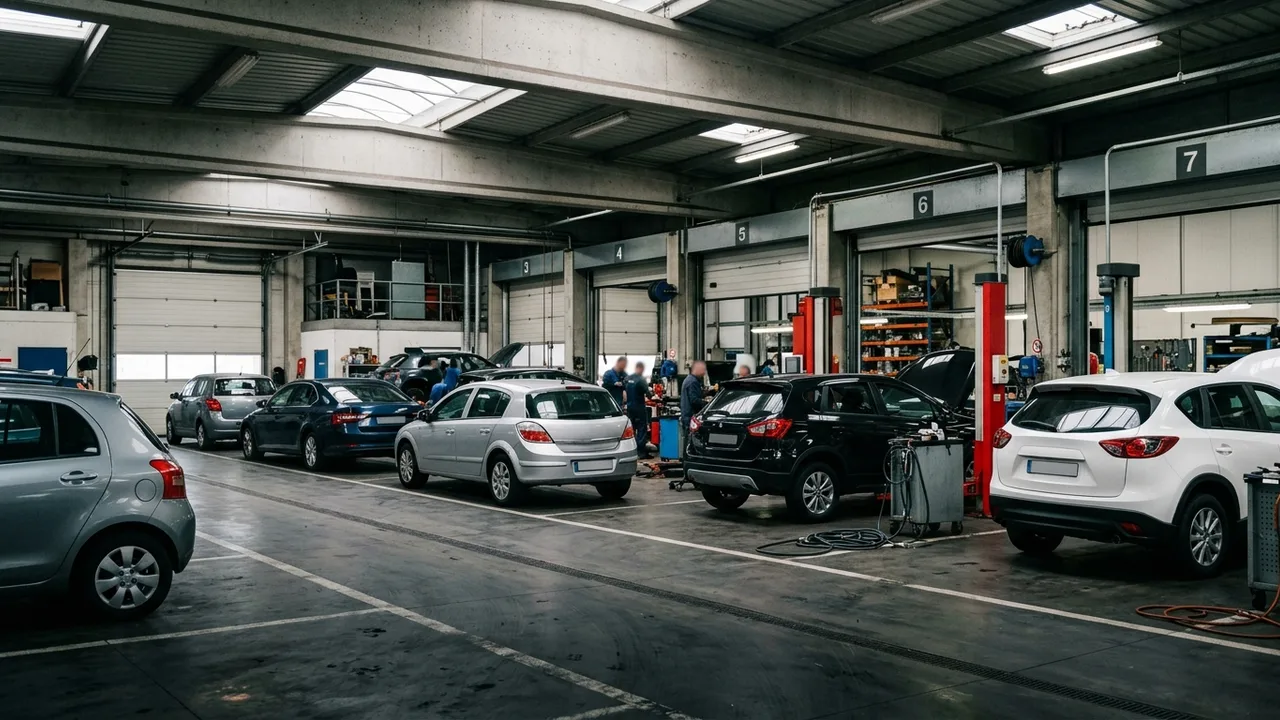
> ## 📊 THE LEAGUE TABLE > Complete from fleet logs. Ranked by fault count weighted by severity and days off road.
Why a league table
Individual fault logs tell you about individual cars. A fleet-wide comparison tells you something more useful: how they compare on the same terms, logged by the same people, to the same standard, over comparable periods.
That's rare. Owner surveys rely on self-reporting; manufacturer data isn't published; press fleets are too fresh. A consistently-logged fleet is a small sample but an honest one.
The table
| Rank | Car | Miles/km | 🔴 | 🟠 | 🟢 | Total faults | Days off road | Unscheduled visits | |---|---|---|---|---|---|---|---|---| | [populate from fleet logs] | | | | | | | | |
Ranking method: weighted by severity (major faults count heavily), with days off road as a significant factor — because a car in a workshop is a car you can't use, and that's the fault's real cost to an owner.
What we count as a fault
Consistent with our standing methodology:
| Category | Examples | |---|---| | Mechanical | anything not working as designed | | Electrical | glitches, warnings, connectivity failures | | Software | crashes, freezes, features that stop working after updates | | Trim and NVH | rattles, squeaks, loose panels | | Build quality | poor fit, paint defects, premature wear |
Severity: 🟢 minor (irritating) · 🟠 moderate (affects usability) · 🔴 major (affects function or safety).
The honest caveats — stated prominently
This is a small sample, and we should say so before anyone over-interprets it.
1. A handful of cars is not a statistical study. One car can be a bad example of a good model, or a good example of a bad one. Our data is real but limited, and a single unlucky vehicle can distort a whole model's apparent record.
2. Age and mileage differ. A car with 40,000 miles has had more opportunity to fail than one with 8,000. The table must normalise for this or state the difference clearly.
3. Use patterns differ. A truck used off-road and a saloon used on motorways face different stresses.
4. Owner surveys have far more data than we do. Where large-scale reliability surveys exist, they're more statistically reliable than our fleet. We'd encourage readers to weigh those alongside this table rather than instead of it.
What our table offers that surveys don't is consistency and detail — every fault logged by the same standard, with severity, resolution, cost and days off road, rather than aggregated satisfaction scores.
What the pattern reveals
Populate from your data. Should address:
1. Software versus hardware. Modern faults skew heavily software. If our fleet confirms that, it's a genuinely important finding for buyers — it suggests judging a manufacturer's software competence matters as much as its engineering.
2. Whether faults were fixed first time. A minor fault resolved promptly is a non-event; the same fault requiring three visits is a real ownership problem. This distinguishes dealer networks more than it distinguishes cars.
3. Newcomers versus established makers. Our fleet includes both. Do the newer brands show more faults, or is that assumption unfounded? This is genuinely worth knowing, and we should report it either way.
4. Powertrain patterns. EVs have fewer mechanical components but more software. Does the fault profile differ in kind rather than quantity?
5. Whether anything was actually serious. In most fleets, most faults are trivial. If nothing major occurred across the fleet, say so plainly — that's a good finding and shouldn't be buried under a list of rattles.
What this means for buyers
1. Every car has faults. The useful questions are what kind, how serious, and how well handled.
2. Judge the dealer network as hard as the car. Mediocre reliability with excellent service can beat the reverse.
3. Days off road matters more than fault count. Three trivial faults fixed same-day beats one moderate fault waiting a fortnight for parts.
4. Software competence is now a reliability attribute. A manufacturer that ships buggy updates is, in practical terms, less reliable.
5. Cross-reference with large-scale surveys. Our fleet is honest but small. Use both.
The bottom line
We log every fault across our fleet by the same standard, and this table compares them on equal terms — weighted by severity and by days off road, which is what a fault actually costs an owner.
It's a small sample and we've said so prominently, because a reliability table presented with false authority would be worse than none at all.
What it offers is consistency: every rattle, glitch and workshop visit recorded to one standard, published in full. Read it alongside large-scale owner surveys, and the picture becomes genuinely useful.
- A fleet-wide table compares cars on the same terms, logged by the same people to the same standard — rare in reliability reporting
- Ranking weights severity and days off road, because time without the car is the fault's real cost to an owner
- We state the caveats prominently: a handful of cars is not a statistical study, and large-scale owner surveys have far more data
- Expect modern faults to skew heavily toward software — which makes a maker's software competence a genuine reliability attribute
- The most useful distinction is whether faults were fixed first time — that separates dealer networks more than it separates cars
Key takeaways
- A fleet-wide table compares cars on the same terms, logged by the same people to the same standard — rare in reliability reporting
- Ranking weights severity and days off road, because time without the car is the fault's real cost to an owner
- We state the caveats prominently: a handful of cars is not a statistical study, and large-scale owner surveys have far more data
- Expect modern faults to skew heavily toward software — which makes a maker's software competence a genuine reliability attribute
- The most useful distinction is whether faults were fixed first time — that separates dealer networks more than it separates cars
Sources & further reading
- True Motion Auto long-term fleet logbooks. *Populate from fleet data before publication. Verified July 2026.*
Figures, prices and policy details were current at the last-updated date above. Automotive pricing, incentives and regulations change frequently — verify time-sensitive details with the linked primary sources. Read our editorial policy and fact-checking standards.